> ## Documentation Index
> Fetch the complete documentation index at: https://hc.starbridge.ai/llms.txt
> Use this file to discover all available pages before exploring further.
# Usage Dashboard
## Overview
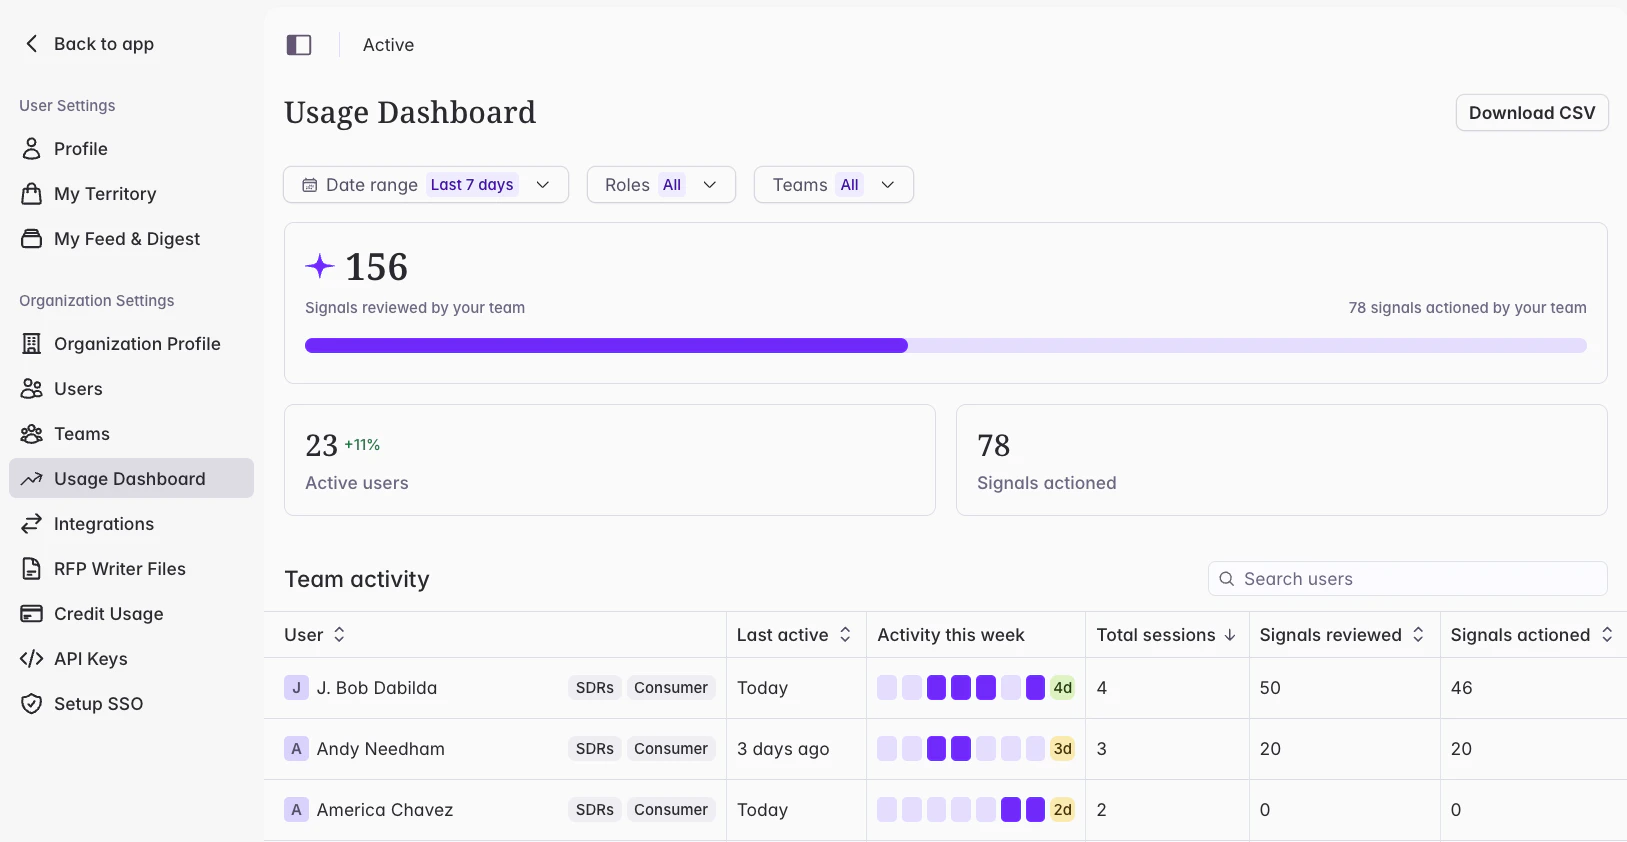
The Usage Dashboard gives you a view of how your team is using Starbridge — who's active, how many signals are being reviewed and acted on, and how individual users are contributing — all filterable by date range and exportable as CSV.
The dashboard is only visible to Admins.
 ## Accessing the dashboard
Go to **Usage Dashboard** in the left navigation.
## Summary tiles
At the top of the dashboard, three tiles show team-wide totals for the selected date range:
* **Active users** — the number of unique users who visited any page or sent a message to Ask Starbridge via Starbridge or Slack in the period
* **Signals reviewed** — signals any user opened or to which they applied any status (Actioned, Starred, Not interested, Needs action); deduplicated by signal across users
* **Signals actioned** — signals any user marked as Actioned, Starred, Not interested, or Needs action; deduplicated by signal across users
* **Chat questions asked** — questions sent by any user to Ask Starbridge. Includes Ask Starbridge from any tab/surface in the product and Ask Starbridge via Slack integration, if installed for your organization.
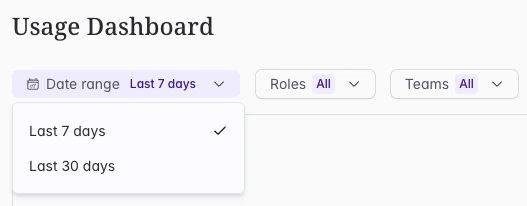
Use the **date range picker** in the top right to switch between **Last 7 days**, **Last 30 days**, **Last 3 months**, or **Last 6 months**. All summary tiles update to reflect the selected period.
## Accessing the dashboard
Go to **Usage Dashboard** in the left navigation.
## Summary tiles
At the top of the dashboard, three tiles show team-wide totals for the selected date range:
* **Active users** — the number of unique users who visited any page or sent a message to Ask Starbridge via Starbridge or Slack in the period
* **Signals reviewed** — signals any user opened or to which they applied any status (Actioned, Starred, Not interested, Needs action); deduplicated by signal across users
* **Signals actioned** — signals any user marked as Actioned, Starred, Not interested, or Needs action; deduplicated by signal across users
* **Chat questions asked** — questions sent by any user to Ask Starbridge. Includes Ask Starbridge from any tab/surface in the product and Ask Starbridge via Slack integration, if installed for your organization.
Use the **date range picker** in the top right to switch between **Last 7 days**, **Last 30 days**, **Last 3 months**, or **Last 6 months**. All summary tiles update to reflect the selected period.
 ## Team activity table
The Team Activity table shows one row per user and includes:
* **Name** — the user's full name
* **Teams** — tags showing the user's assigned teams, sorted alphabetically; the role tag (Consumer, Builder, or Admin) always appears last
* **Activity this week** — a day-by-day breakdown of the past 7 days showing which days the user was active, with a total count (0–7); only visible when **Last 7 days** is selected
* **Last active** — the date the user was last active in Starbridge; always current and not affected by the date range filter
* **Sessions** — total sessions in the selected date range; a session is defined as any signal metric produced within a 60-minute window
* **Signals reviewed** — signals this user opened or to which they applied any status (Actioned, Starred, Not interested, Needs action) in the selected date range
* **Signals actioned** — signals this user marked as Actioned, Starred, Not interested, or Needs action in the selected date range
* **Chat sessions** — unique chat sessions initiated by this user with Ask Starbridge. E.g., each time a user starts a new chat or clicks 'New chat', this initiates a new chat session.
* **Chat questions asked** — questions sent by this user to Ask Starbridge. Includes Ask Starbridge from any tab/surface in the product and Ask Starbridge via Slack integration, if installed for your organization.
The table defaults to alphabetical order by first name (A–Z).
### Sorting
Click any column header to sort by that column. Activating a new sort clears any existing sort. Click the same header again to reverse the direction.
### Filtering
Use the **Team** and **Role** dropdowns above the table to filter the list to specific segments. Both filters support multi-select.
### Searching
Use the **search field** to find a specific user by name. The search is case-insensitive and hides rows that don't match.
## Exporting data
Click **Export** to download CSV files:
* **Summary file** — the team-wide totals shown in the summary tiles
* **Team activity file** — the full per-user table with all columns
## A note on historical data
Analytics tracking begins when the dashboard goes live. Last 7 days, Last 30 days, Last 3 months, and Last 6 months will become available as your team accumulates usage history over time.
## Related articles
Watch the full admin setup walkthrough in the platform.
Add users, assign roles, and create teams for your organization.
## Team activity table
The Team Activity table shows one row per user and includes:
* **Name** — the user's full name
* **Teams** — tags showing the user's assigned teams, sorted alphabetically; the role tag (Consumer, Builder, or Admin) always appears last
* **Activity this week** — a day-by-day breakdown of the past 7 days showing which days the user was active, with a total count (0–7); only visible when **Last 7 days** is selected
* **Last active** — the date the user was last active in Starbridge; always current and not affected by the date range filter
* **Sessions** — total sessions in the selected date range; a session is defined as any signal metric produced within a 60-minute window
* **Signals reviewed** — signals this user opened or to which they applied any status (Actioned, Starred, Not interested, Needs action) in the selected date range
* **Signals actioned** — signals this user marked as Actioned, Starred, Not interested, or Needs action in the selected date range
* **Chat sessions** — unique chat sessions initiated by this user with Ask Starbridge. E.g., each time a user starts a new chat or clicks 'New chat', this initiates a new chat session.
* **Chat questions asked** — questions sent by this user to Ask Starbridge. Includes Ask Starbridge from any tab/surface in the product and Ask Starbridge via Slack integration, if installed for your organization.
The table defaults to alphabetical order by first name (A–Z).
### Sorting
Click any column header to sort by that column. Activating a new sort clears any existing sort. Click the same header again to reverse the direction.
### Filtering
Use the **Team** and **Role** dropdowns above the table to filter the list to specific segments. Both filters support multi-select.
### Searching
Use the **search field** to find a specific user by name. The search is case-insensitive and hides rows that don't match.
## Exporting data
Click **Export** to download CSV files:
* **Summary file** — the team-wide totals shown in the summary tiles
* **Team activity file** — the full per-user table with all columns
## A note on historical data
Analytics tracking begins when the dashboard goes live. Last 7 days, Last 30 days, Last 3 months, and Last 6 months will become available as your team accumulates usage history over time.
## Related articles
Watch the full admin setup walkthrough in the platform.
Add users, assign roles, and create teams for your organization.