> ## Documentation Index
> Fetch the complete documentation index at: https://hc.starbridge.ai/llms.txt
> Use this file to discover all available pages before exploring further.
# April 2026: Usage Dashboard
## Overview
Until now, there's been no way to see how your team is actually using Starbridge. The Usage Dashboard now gives admins a clear view of how your team is engaging with Starbridge — which reps are active, where they're spending their time, and whether the signals you're surfacing are being acted on.
 ## What admins experience
The Usage Dashboard is available from **Settings**. Access is restricted to users with the Admin role.
At the top of the dashboard, three summary tiles show team-wide activity for the selected time period: active users, signals reviewed, and signals actioned. A date range picker lets you filter data to various date ranges.
## What admins experience
The Usage Dashboard is available from **Settings**. Access is restricted to users with the Admin role.
At the top of the dashboard, three summary tiles show team-wide activity for the selected time period: active users, signals reviewed, and signals actioned. A date range picker lets you filter data to various date ranges.
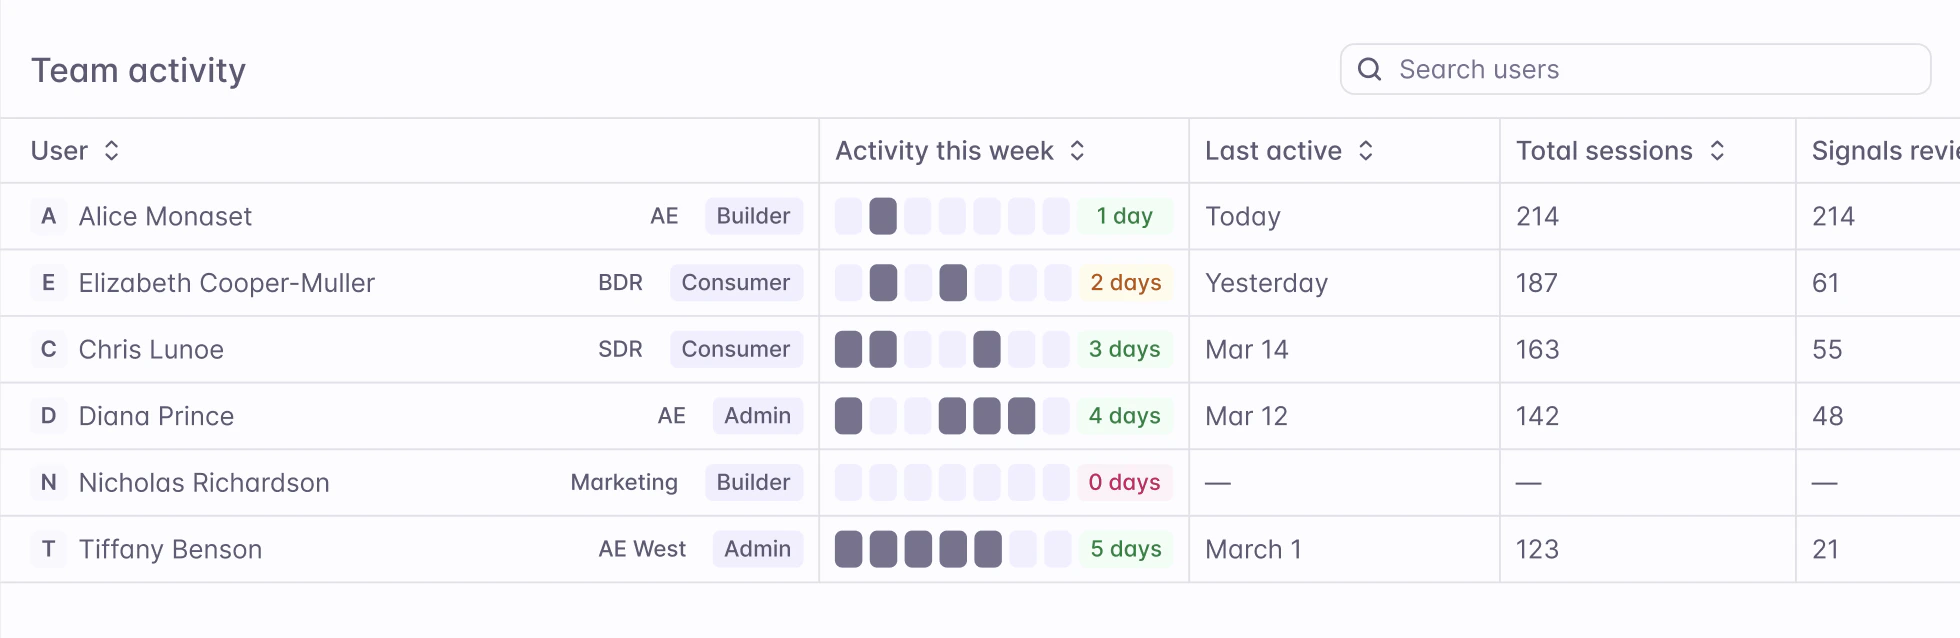
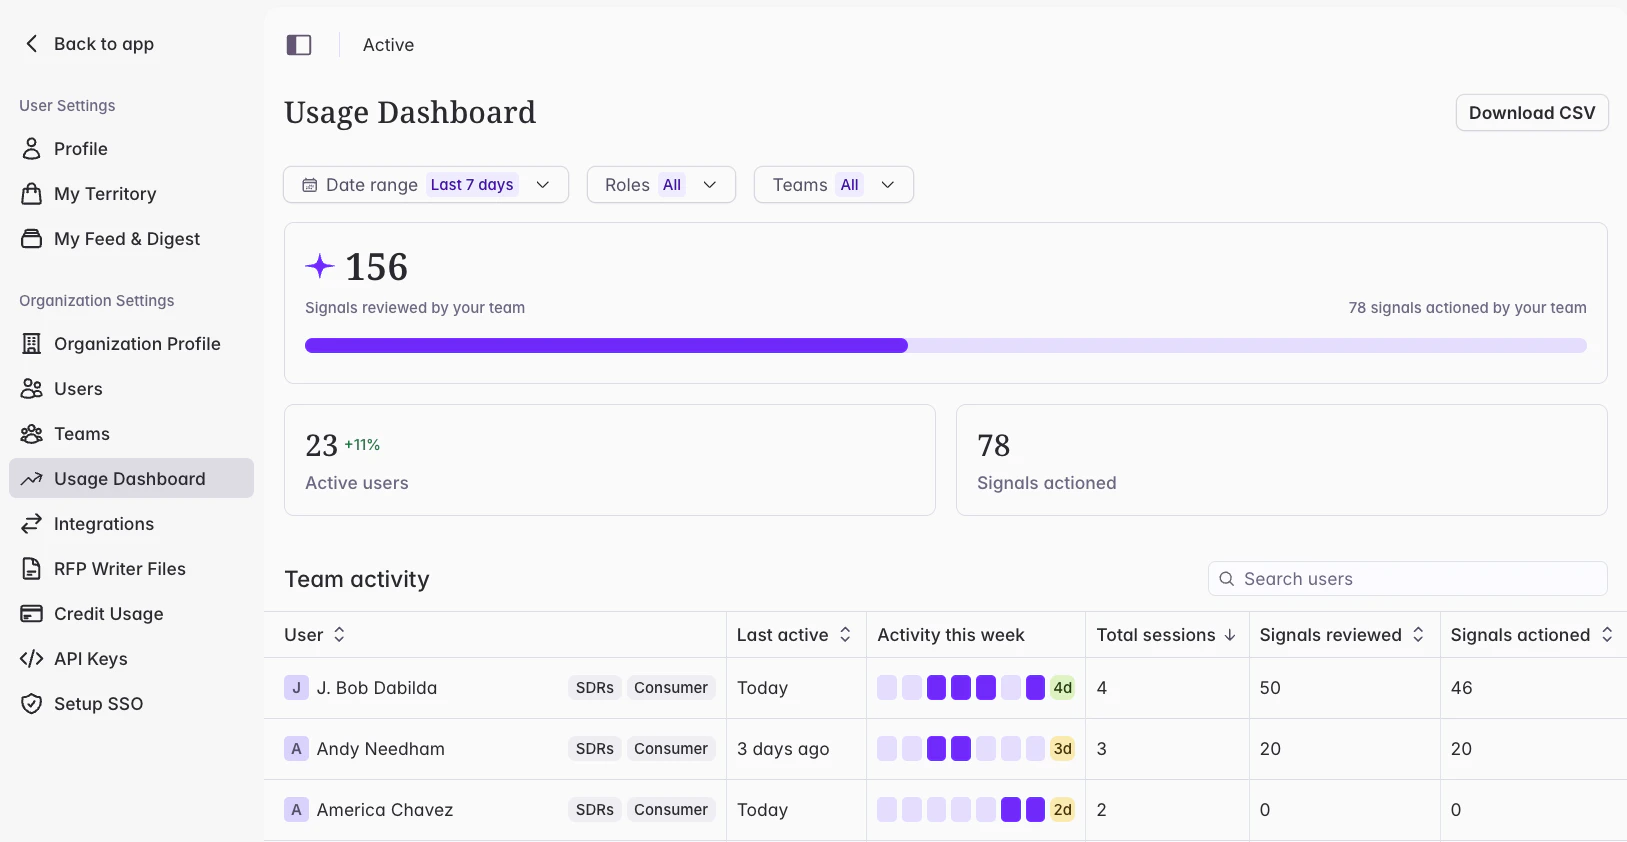 Below the summary, the **Team Activity table** shows a row for each user with their last active date, and individual totals for sessions, signals reviewed, and signals actioned.
When you're ready to share the data, use the **Download CSV** button to download a summary file or a full team activity file.
A note on historical data: analytics tracking begins when the dashboard goes live. Longer date ranges (Last 30 days, Last 3 months) will become available as your team builds up usage history.
## Get started
The Usage Dashboard is available now. Go to **Settings** — you'll see it in the left nav if you have the Admin role.
Below the summary, the **Team Activity table** shows a row for each user with their last active date, and individual totals for sessions, signals reviewed, and signals actioned.
When you're ready to share the data, use the **Download CSV** button to download a summary file or a full team activity file.
A note on historical data: analytics tracking begins when the dashboard goes live. Longer date ranges (Last 30 days, Last 3 months) will become available as your team builds up usage history.
## Get started
The Usage Dashboard is available now. Go to **Settings** — you'll see it in the left nav if you have the Admin role.