Overview
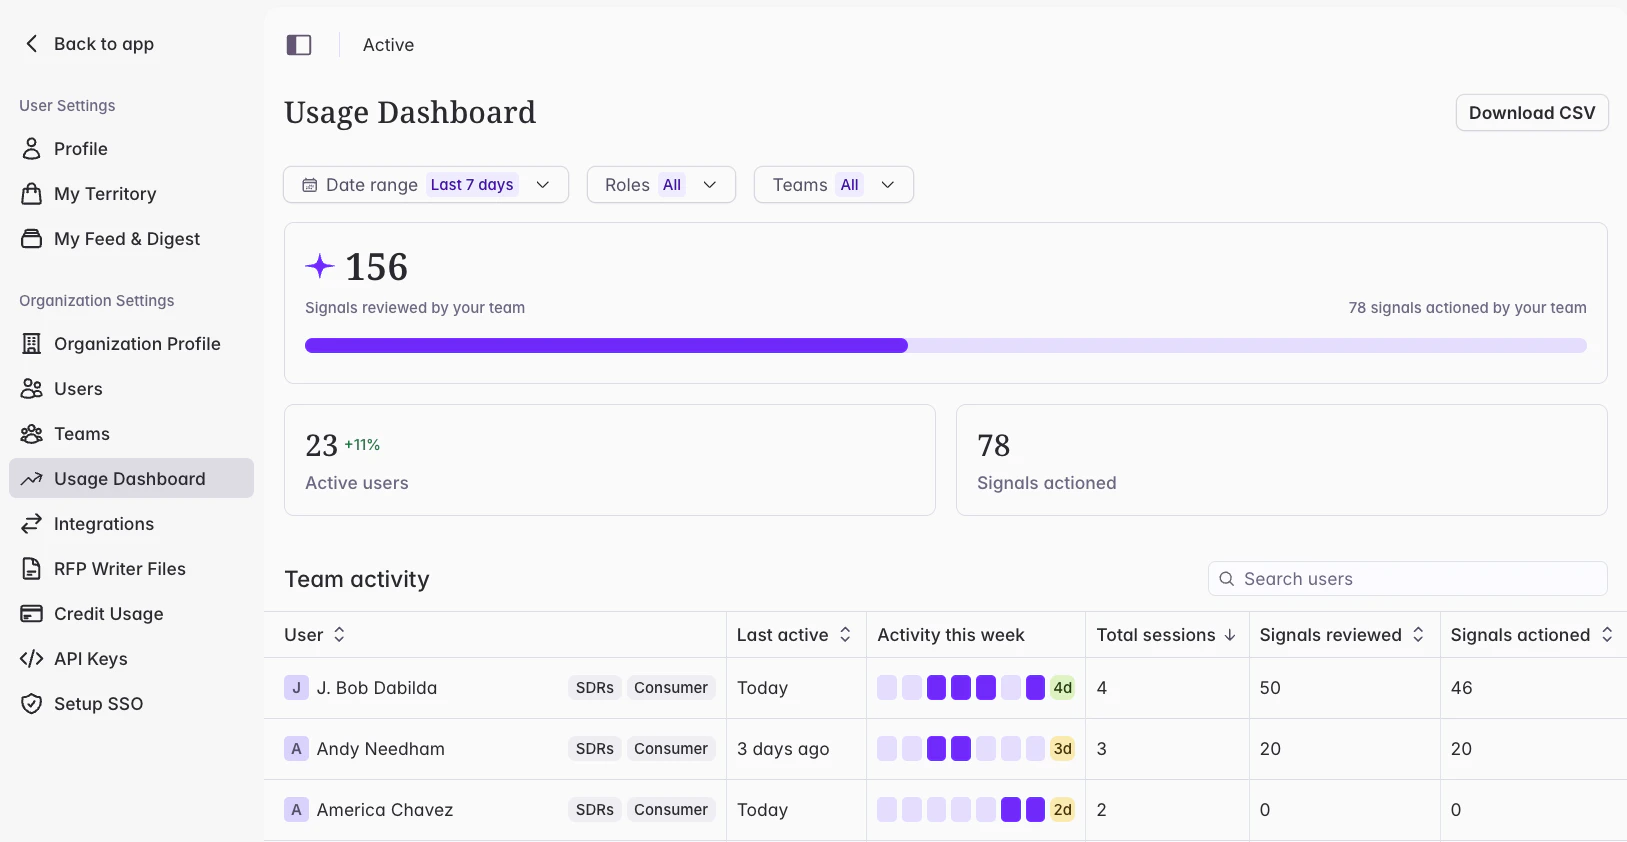
Until now, there’s been no way to see how your team is actually using Starbridge. The Usage Dashboard now gives admins a clear view of how your team is engaging with Starbridge — which reps are active, where they’re spending their time, and whether the signals you’re surfacing are being acted on.
What admins experience
The Usage Dashboard is available from Settings. Access is restricted to users with the Admin role. At the top of the dashboard, three summary tiles show team-wide activity for the selected time period: active users, signals reviewed, and signals actioned. A date range picker lets you filter data to various date ranges.